Welcome!

Welcome to the first post of the A to Z Challenge! My theme for the month of April is productivity. I'll be sharing some techniques, interviews, and productivity-related tips to help you make the most of your time.
 Photo by Kenneth Hein
 How are you currently spending your days? Do you have a good sense of where the hours go? One step to improving productivity is to track how you actually spend time (versus estimating it). In 168 Hours: You Have More Time Than You Think, author Laura Vanderkam recommends tracking your activities for a week. You can monitor in 15 minute increments or make a note of the time when you switch tasks. (More on this later in the alphabet....)
I did this as an experiment in January. Here's a graph of how I spent my work time for that week. (I tracked sleeping, eating, running errands, etc but didn't want to bore people with that here.)
I did this as an experiment in January. Here's a graph of how I spent my work time for that week. (I tracked sleeping, eating, running errands, etc but didn't want to bore people with that here.)
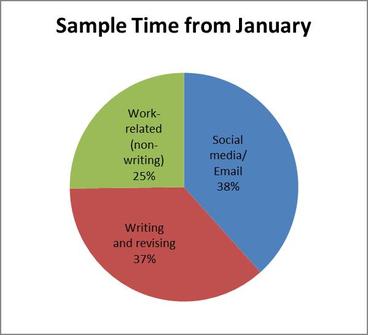
The time spent checking social media, reading blogs, and responding to email was a surprise. I realized too late that I shouldn't have lumped all of those activities into the same time bucket. Responding to email can be a legitimate, useful task, but looking at Facebook--not so much. The "work-related/non-writing" category covers items like researching potential festivals, updating my website, etc.
I did this experiment again in March to see if I'd improved by time distribution. Check back at letter D for the results....
I did this experiment again in March to see if I'd improved by time distribution. Check back at letter D for the results....
You don't need to make a chart to analyze your time, but tracking it is definitely a useful starting point. What do you think you spend most of your waking hours doing?


 RSS Feed
